figures
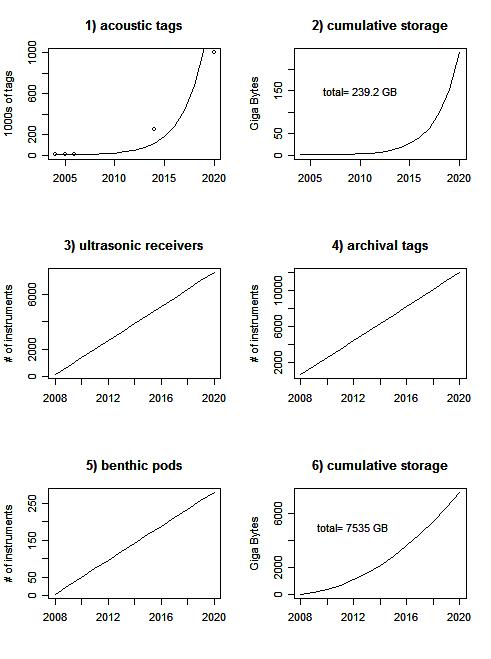
Fig 1 is an exponential curve fitted to POST operations reports in Table 1 and projected limits of tag code space. Fig 2 is from multiplying the Fig 1 curve by avg # of detects per tag (209) and # of bytes per detect (250). Fig 3-5 are a linear estimate from the planned OTN deployments in Table 2. Fig 6 is the combined cumulative storage estimate in Table 3.
General inquiries
+1 902 494 4101
otn@dal.ca
Data Centre
otndc@dal.ca
Media Contact
anja.samardzic@dal.ca
© 2026 Ocean Tracking Network